'Beco Taro'supporting Fukushima


2-16 Sugitsuma-cho, Fukushima City, Fukushima 960-8670, Japan
Tel: +81-(0)24-521-1111
© 2023 Fukushima Prefecture.


![Fukushima agricultural products [English・中文・한국어]](/img/portal2023-english/en_banner-07.png)


 Revitalization of our prefecture, once severely damaged by the unprecedented compound disaster of earthquake, tsunami and nuclear accident caused by the Great East Japan Earthquake, is progressing steadily. On the other hand, the prefecture also faces distinctive challenges such as the decommissioning of nuclear facilities, harmful rumours and fading public interest. This website is an official portal site of Fukushima Prefecture to present the current status of Fukushima's revitalization. Divided into five categories, including 'Reconstruction and Revitalization from the Great East Japan Earthquake,' we hope that this website will help raise awareness of the current situation in our prefecture among a wide audience. We will continue to strive for a brighter future for Fukushima, aiming for complete revitalization from this unprecedented compound disaster under the slogan of 'Making it a reality, one at a time. Fukushima'.


Materials that summarise the damage in Fukushima Prefecture and the progress made so far in the revitalization process are available here.

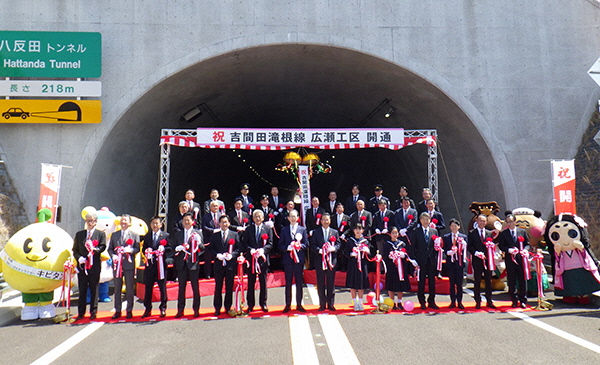
Measures for reconstruction and revitalization such as decommissioning, decontamination as well as re-establishment of living environment are in motion.


A large number of people, including those affected by the earthquake and tsunami who were forced to evacuate due to the evacuation orders following the nuclear accident, are still living in evacuation shelters both inside and outside Fukushima Prefecture. Fukushima Prefecture is providing meticulous support and implementing measures that cater to the unique circumstances of each individual, whether living in prolonged evacuation or are aiming for early return to their hometowns.

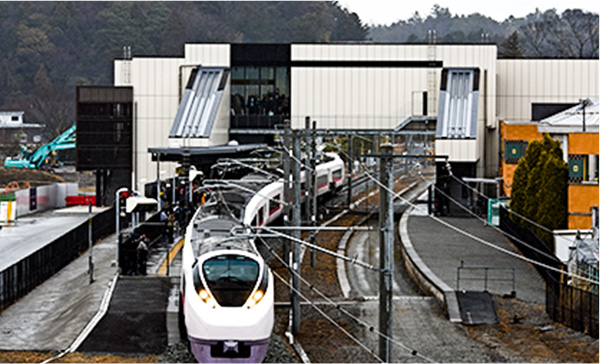
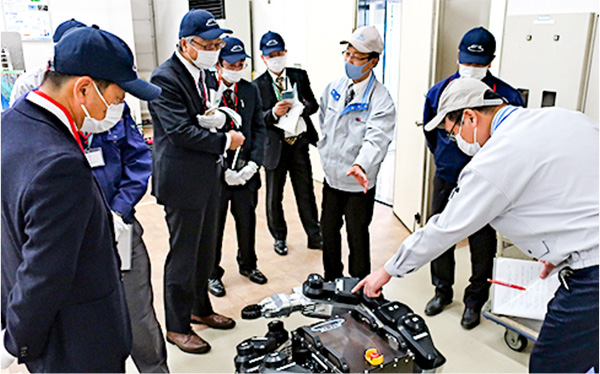
To drive the reconstruction and revitalization of Fukushima Prefecture, infrastructures of R&D and industry creation in sectors of energy, healthcare and robotics among others shall be proceeded with a focus on the "Fukushima Innovation Coast Framework".

We would like to express our sincere gratitude for the warm support we have received from both domestic and international communities. Earning your understanding of Fukushima Today and its charms, your spirits of empathy are the greatest encouragement for us.

We will continue to collaborate with the national government and local municipalities to advance reconstruction and revitalization efforts so that a tangible sense of revitalization can be felt by the people of the prefecture.