Air radiation dose rate map based on Fukushima Prefecture's environmental radiation monitoring and mesh survey results
- Radiation dose in the air refers to the quantity (intensity) of radiation in a given space, typically including gamma rays in the atmosphere, from the earth and cosmic rays. Radiation dose rate in the air is the dose measured per unit time in a specific size of space.
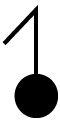
- Figure (1) illustrates data taken approximately one month after the disaster. Figure (2) represents data from FY2023. In the Nakadori (Central Region) and Hamadori (Coastal Region) areas, the effects of natural decay of radioactive materials and decontamination are evident. Moreover, the Aizu region has returned to air dose rate levels comparable to those before the nuclear accident.
- Click here for air radiation dose rate map data from immediately after the disaster to the present.
→Environmental radiation monitoring in mesh survey results
*Created using the Geospatial Information Authority of Japan's "Digital Elevation Model of Fundamental Geospatial Data" and the Ministry of Land, Infrastructure, Transport and Tourism's "Digital National Land Information (Administrative District Boundaries, Roads)."
Figure (1): Data approximately one month after the earthquake disaster.
12–16 Apr. 2011
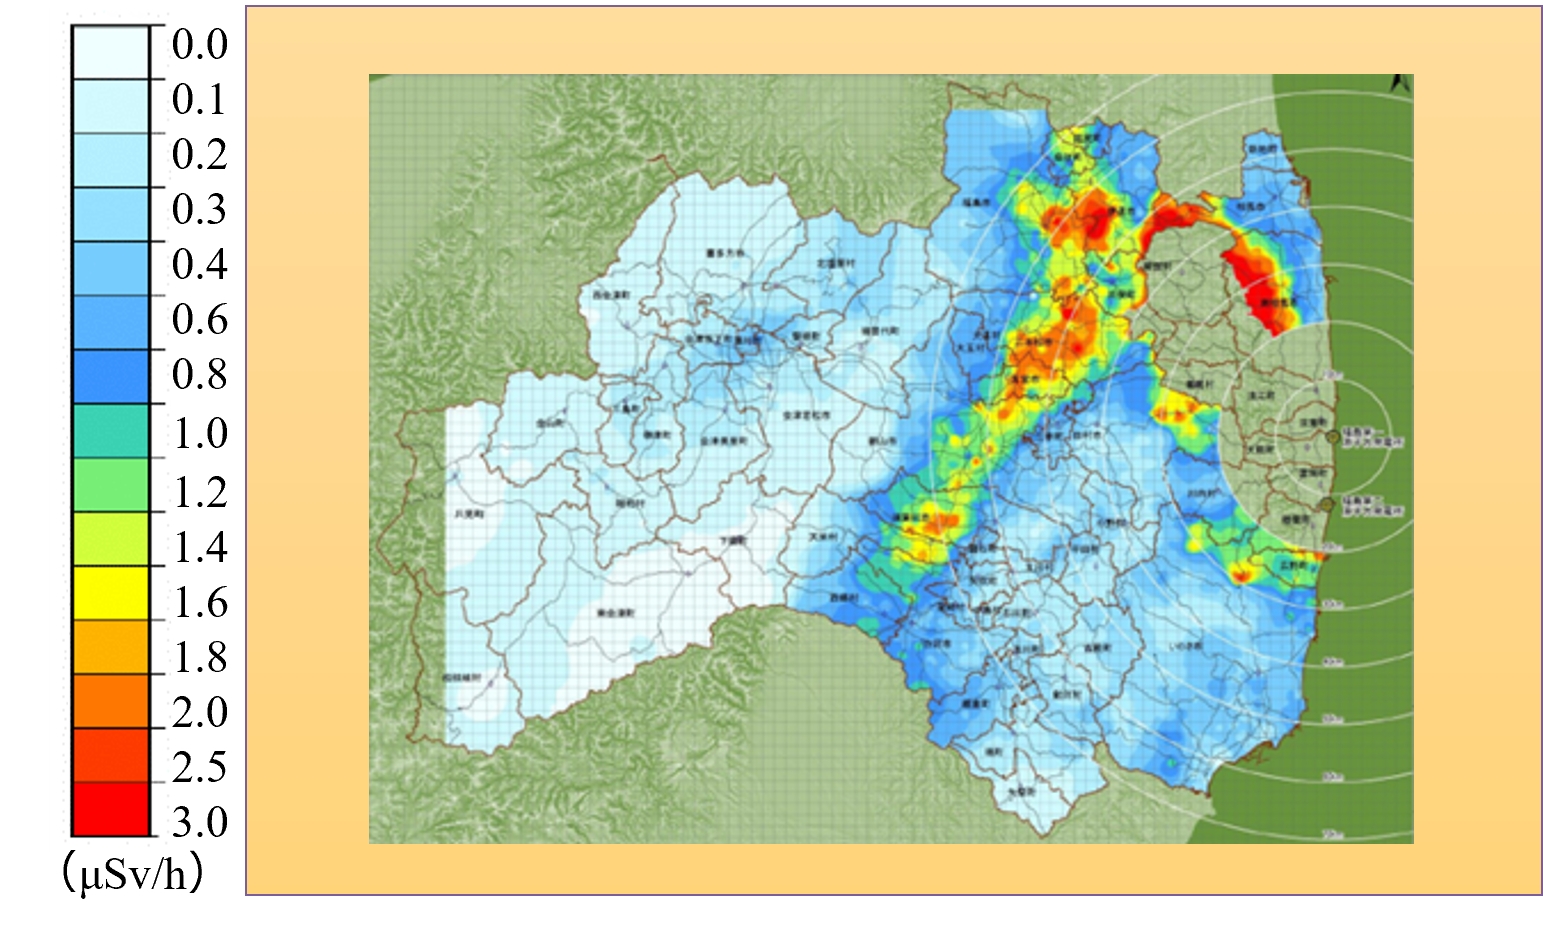
Figure (2): Data from FY2024.
15 Apr. 2024 to 14 May. 2024
About air dose rates
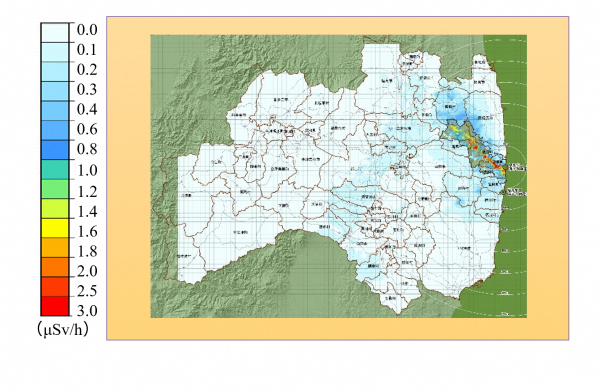
- Compared to the radiation levels immediately after the earthquake, the current levels have significantly decreased due to natural decay and decontamination efforts. They have been reduced to a level comparable to the world's major cities and most of the cities in the country.
- Click here for data on air radiation dose rates from immediately after the disaster to the present.
→Air radiation dose monitoring results
Comparison of air dose rate, Fukushima, domestic and internatinal locations
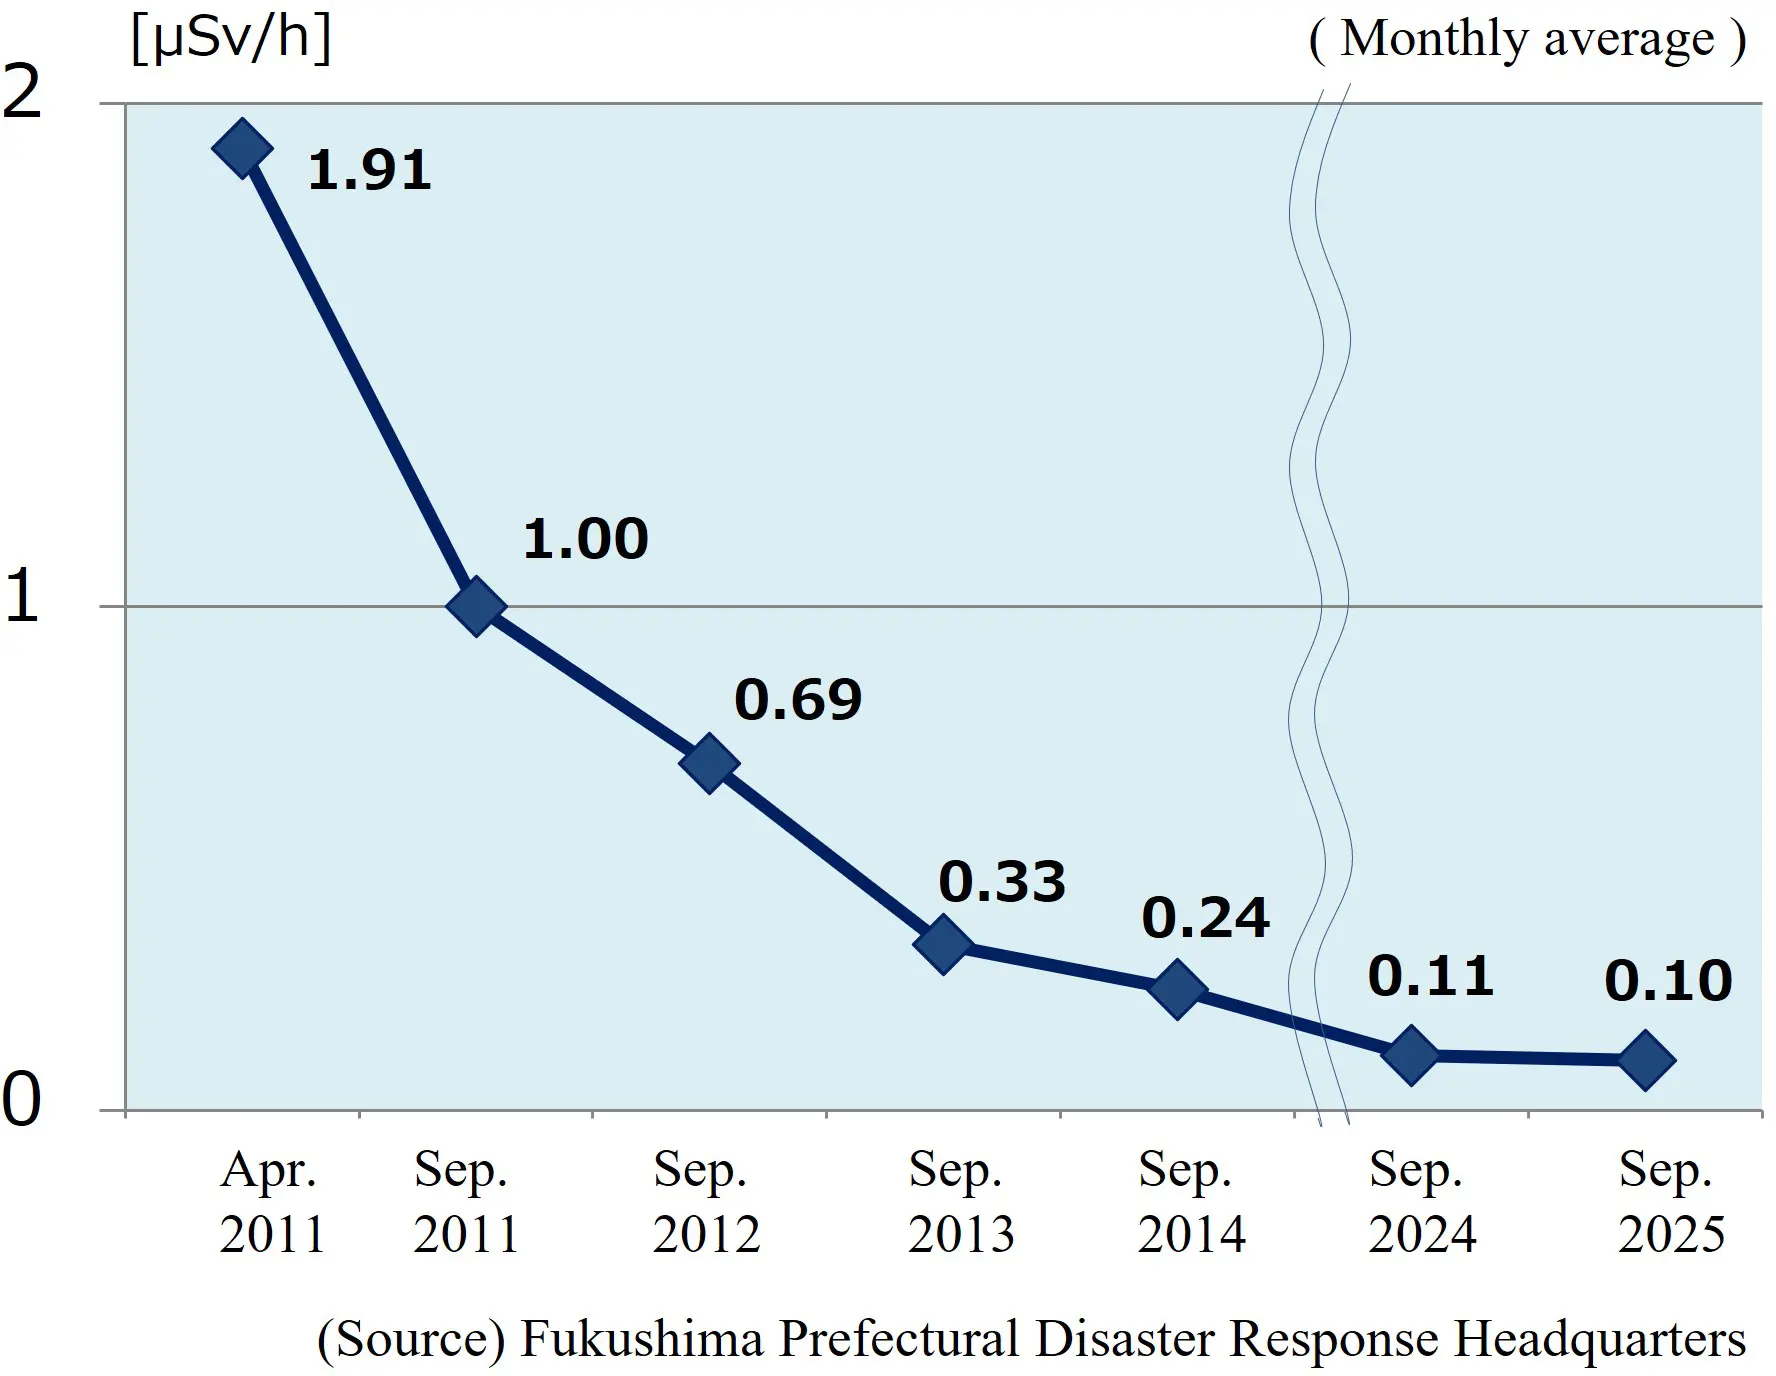
Transition of air dose rate in Fukushima City
- The graph below illustrates the changes in the air dose rate in Fukushima City. Immediately after the earthquake, it measured at 1.91 μ㏜/h, but the dose rate has gradually decreased over the years through natural decay and decontamination efforts. By FY2025, it had reached 0.10 μ㏜/h (approximately 1/19th of the value immediately after the earthquake).
Information on various monitoring inspections, etc.
Information on monitoring test results such as environmental radiation in living spaces, and agricultural, forestry, and fisheries products is provided here; please see the link below.
Information on various monitoring inspections, etc.
Fukushima Prefecture's environmental radiation monitoring newsletter "Fukumoni"
Fukushima Prefecture's environmental radiation monitoring newsletter "Fukumoni" is published to provide updates on the current radiation status in the prefecture. For more information, please visit the following website.
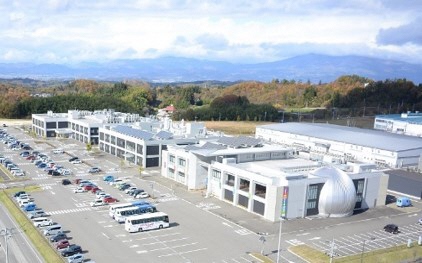
Fukushima Prefectural Centre for Environmental Creation (CEC) (Miharu Town)
CEC serves as a base for comprehensive efforts towards environmental recovery and creation. It performs environmental radiation monitoring, research, and the collection and provision of monitoring data and research results. It also provides education, training, and opportunities for information exchange and communication at the Information and Communication Building, "Commutan Fukushima".
Fukushima Prefectural Centre for Environmental Creation website
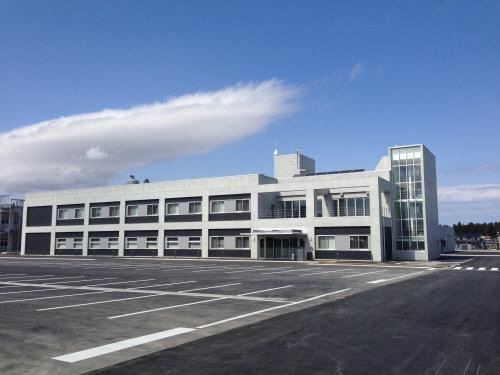
Environmental Radiation Monitoring Centre (Minamisoma City)
The Environmental Radiation Monitoring Centre, part of the Centre for Environmental Creation, is a facility that performs monitoring in the vicinity of nuclear power stations and constantly observes spatial radiation.
Cooperation with research institutes in Japan and abroad
Fukushima Prefecture has been working on cooperative projects with the IAEA (International Atomic Energy Agency), as well as on research and environmental education programs in collaboration with the JAEA, NIES, and F-REI (Fukushima Institute for Research, Education and Innovation).
The "Research" page on the website of the Fukushima Prefectural Centre for Environmental Creation
![]()
PDF形式のファイルをご覧いただく場合には、Adobe社が提供するAdobe Readerが必要です。
Adobe Readerをお持ちでない方は、バナーのリンク先からダウンロードしてください。(無料)